Target Counties
There are sixteen counties in Kansas with a population of 20,000 or more with no UPCI church.

Douglas County comprises the Lawrence, KS Metropolitan Statistical Area, which is also included in the Kansas City-Overland Park-Kansas City, MO-KS Combined Statistical Area.
As of the 2000 census, there were 99,962 people, 38,486 households, and 21,167 families residing in the county. The population density was 219 people per square mile (84/km2). There were 40,250 housing units at an average density of 88 per square mile (34/km2). The racial makeup of the county was 86.1% White, 4.2% Black or African American, 2.6% Native American, 3.1% Asian, 0.1% Pacific Islander, 1.2% from other races, and 2.7% from two or more races. Hispanic or Latino of any race were 3.3% of the population.
There were 38,486 households, out of which 27.4% had children under the age of 18 living with them, 43.1% were married couples living together, 8.5% had a female householder with no husband present, and 45.0% were non-families. 28.5% of all households were made up of individuals, and 5.8% had someone living alone who was 65 years of age or older. The average household size was 2.37 and the average family size was 2.97.
In the county, the population was spread out, with 20.4% under the age of 18, 26.4% from 18 to 24, 28.3% from 25 to 44, 16.9% from 45 to 64, and 7.9% who were 65 years of age or older. The median age was 27 years. For every 100 females there were 98.70 males. For every 100 females age 18 and over, there were 97.70 males.
The median income for a household in the county was $37,547, and the median income for a family was $53,991. Males had a median income of $35,577 versus $27,225 for females. The per capita income for the county was $19,952. About 6.2% of families and 15.9% of the population were below the poverty line, including 9.0% of those under age 18 and 7.3% of those age 65 or over.
For more information visit: Douglas County, Kansas - Wikipedia

The county is a part of the Kansas City, MO-KS Metropolitan Statistical Area.
As of the U.S. Census in 2000, there were 68,691 people, 23,071 households, and 17,210 families residing in the county. The population density was 148 people per square mile (57/km2). There were 24,401 housing units at an average density of 53 per square mile (20/km2). The racial makeup of the county was 84.2% White, 10.4% Black or African American, 0.7% Native American, 1.1% Asian, 0.1% Pacific Islander, 1.2% from other races, and 2.2% from two or more races. Hispanic or Latino of any race were 3.8% of the population.
There were 23,071 households, out of which 38.9% had children under the age of 18 living with them, 61.4% were married couples living together, 9.5% had a female householder with no husband present, and 25.4% were non-families. 21.7% of all households were made up of individuals, and 8.1% had someone living alone who was 65 years of age or older. The average household size was 2.69 and the average family size was 3.15.
In the county, the population was spread out, with 26.7% under the age of 18, 8.2% from 18 to 24, 33.0% from 25 to 44, 22.2% from 45 to 64, and 9.8% who were 65 years of age or older. The median age was 36 years. For every 100 females there were 113.50 males. For every 100 females age 18 and over, there were 116.90 males.
The median income for a household in the county was $48,114, and the median income for a family was $55,805. Males had a median income of $40,047 versus $26,029 for females. The per capita income for the county was $20,292. About 4.8% of families and 6.7% of the population were below the poverty line, including 8.8% of those under age 18 and 7.5% of those age 65 or over.
For more information visit: Leavenworth County, Kansas - Wikipedia

Riley County is part of the Manhattan, KS Metropolitan Statistical Area. Millennials (ages 15–34 years old) make up 53.6% of the population of Riley County, one of the highest rates in the United States.
2000 census
As of the census of 2000, there were 62,843 people, 22,137 households, and 12,263 families residing in the county. The population density was 103 people per square mile (40/km2). There were 23,397 housing units at an average density of 38 per square mile (15/km2). The racial makeup of the county was 84.78% White, 6.88% Black or African American, 0.63% Native American, 3.22% Asian, 0.17% Pacific Islander, 1.89% from other races, and 2.43% from two or more races. 4.57% of the population were Hispanic or Latino of any race.
There were 22,137 households, out of which 27.80% had children under the age of 18 living with them, 46.20% were married couples living together, 6.80% had a female householder with no husband present, and 44.60% were non-families. 27.50% of all households were made up of individuals, and 6.10% had someone living alone who was 65 years of age or older. The average household size was 2.42 and the average family size was 2.99.
In the county, the population was spread out, with 18.80% under the age of 18, 34.50% from 18 to 24, 25.90% from 25 to 44, 13.30% from 45 to 64, and 7.50% who were 65 years of age or older. The median age was 24 years. For every 100 females, there were 114.30 males. For every 100 females age 18 and over, there were 115.40 males.
The median income for a household in the county was $32,042, and the median income for a family was $46,489. Males had a median income of $26,856 versus $23,835 for females. The per capita income for the county was $16,349. About 8.50% of families and 20.60% of the population were below the poverty line, including 11.20% of those under age 18 and 6.70% of those age 65 or over.
For more information visit: Riley County, Kansas - Wikipedia

Butler County is part of the Wichita, KS Metropolitan Statistical Area.
As of the U.S. Census in 2000, 59,482 people, 21,527 households, and 16,059 families resided in the county. The population density was 42 people per square mile (16/km2). There were 23,176 housing units at an average density of 16 per square mile (6/km2). The county's racial makeup was 94.94% White, 1.38% Black or African American, 0.91% Native American, 0.40% Asian, 0.03% Pacific Islander, 0.66% from other races, and 1.69% two or more races. Hispanic or Latino of any race were 2.25% of the population.
There were 21,527 households, of which 37.90% had children under the age of 18 living with them, 62.60% were married couples living together, 8.30% had a female householder with no husband present, and 25.40% were non-families. 21.90% of all households were made up of individuals, and 9.40% had someone living alone who was 65 years of age or older. The average household size was 2.67 and the average family size was 3.13.
In the county, the population was spread out, with 28.60% under the age of 18, 8.30% from 18 to 24, 28.80% from 25 to 44, 21.70% from 45 to 64, and 12.60% who were 65 years of age or older. The median age was 36 years. For every 100 females, there were 100.90 males. For every 100 females age 18 and over, there were 98.80 males.
The county's median household income was $45,474, and the median family income was $53,632. Males had a median income of $38,675 versus $26,109 for females. The county's per capita income was $20,150. About 5.40% of families and 7.30% of the population were below the poverty line, including 9.00% of those under age 18 and 6.40% of those age 65 or over.
For more information visit: Butler County, Kansas - Wikipedia
The Pittsburg Micropolitan Statistical Area includes all of Crawford County.
As of the 2000 census, there were 38,242 people, 15,504 households, and 9,441 families residing in the county. The population density was 64 people per square mile (25/km2). There were 17,221 housing units at an average density of 29 per square mile (11/km2). The racial makeup of the county was 93.29% White, 1.83% Black or African American, 0.94% Native American, 1.11% Asian, 0.09% Pacific Islander, 1.11% from other races, and 1.63% from two or more races. Hispanic or Latino of any race were 2.38% of the population. 23.5% were of German, 12.5% American, 10.4% English, 10.2% Irish and 8.6% Italian ancestry according to Census 2000.
There were 15,504 households, out of which 28.50% had children under the age of 18 living with them, 47.90% were married couples living together, 9.30% had a female householder with no husband present, and 39.10% were non-families. 30.60% of all households were made up of individuals, and 13.40% had someone living alone who was 65 years of age or older. The average household size was 2.35 and the average family size was 2.96.
In the county, the population was spread out, with 22.90% under the age of 18, 16.40% from 18 to 24, 25.00% from 25 to 44, 20.20% from 45 to 64, and 15.50% who were 65 years of age or older. The median age was 34 years. For every 100 females there were 95.00 males. For every 100 females age 18 and over, there were 92.40 males.
The median income for a household in the county was $29,409, and the median income for a family was $40,582. Males had a median income of $27,881 versus $21,517 for females. The per capita income for the county was $16,245. About 9.40% of families and 16.00% of the population were below the poverty line, including 17.00% of those under age 18 and 10.30% of those age 65 or over.
Fpr more information visit: Crawford County, Kansas - Wikipedia

Finney County is included in the Garden City, KS Micropolitan Statistical Area.
2010 Census
As of the 2010 census there were 36,776 people, 12,359 households and 8,903 families living in the county. The racial makeup of the county was 77.0% White, 2.3% Black or African American, 0.9% Native American, 3.4% Asian, 0.0% Pacific Islander, 13.6% from other races, and 2.9% from two or more races. Hispanic or Latino of any race were 46.7% of the population.
2000 Census
As of the 2000 census, there were 40,523 people, 12,948 households, and 9,749 families living in the county. The population density was 31 people per square mile (12/km2). There were 13,763 housing units at an average density of 11 per square mile (4/km2). The racial makeup of the county was 69.05% White, 1.25% Black or African American, 0.96% Native American, 2.87% Asian, 0.08% Pacific Islander, 22.99% from other races, and 2.80% from two or more races. Hispanic or Latino of any race were 43.30% of the population.
There were 12,948 households, out of which 46.00% had children under the age of 18 living with them, 59.80% were married couples living together, 10.50% had a female householder with no husband present, and 24.70% were non-families. 19.60% of all households were made up of individuals, and 6.30% had someone living alone who was 65 years of age or older. The average household size was 3.09 and the average family size was 3.55.
In the county, the population was spread out, with 34.30% under the age of 18, 11.00% from 18 to 24, 31.10% from 25 to 44, 16.60% from 45 to 64, and 7.00% who were 65 years of age or older. The median age was 28 years. For every 100 females there were 104.20 males. For every 100 females age 18 and over, there were 103.30 males.
The median income for a household in the county was $38,474, and the median income for a family was $42,839. Males had a median income of $29,948 versus $21,510 for females. The per capita income for the county was $15,377. About 10.00% of families and 14.20% of the population were below the poverty line, including 18.60% of those under age 18 and 10.70% of those age 65 or over.
For more information visit: Finney County, Kansas - Wikipedia

Lyon County comprises the Emporia, KS Micropolitan Statistical Area.
As of the census of 2000, there were 35,935 people, 13,691 households, and 8,639 families residing in the county. The population density was 42 people per square mile (16/km2). There were 14,757 housing units at an average density of 17 per square mile (7/km2). The racial makeup of the county was 83.27% White, 2.27% Black or African American, 0.47% Native American, 2.04% Asian, 0.01% Pacific Islander, 9.79% from other races, and 2.16% from two or more races. 16.72% of the population were Hispanic or Latino of any race.
There were 13,691 households, out of which 32.60% had children under the age of 18 living with them, 50.80% were married couples living together, 8.40% had a female householder with no husband present, and 36.90% were non-families. 28.50% of all households were made up of individuals, and 9.80% had someone living alone who was 65 years of age or older. The average household size was 2.51 and the average family size was 3.12.
In the county, the population was spread out, with 25.70% under the age of 18, 16.20% from 18 to 24, 27.20% from 25 to 44, 19.10% from 45 to 64, and 11.60% who were 65 years of age or older. The median age was 31 years. For every 100 females, there were 97.40 males. For every 100 females age 18 and over, there were 95.20 males.
The median income for a household in the county was $32,819, and the median income for a family was $43,112. Males had a median income of $28,865 versus $21,338 for females. The per capita income for the county was $15,724. About 9.60% of families and 14.50% of the population were below the poverty line, including 15.60% of those under age 18 and 9.20% of those age 65 or over.
For more information visit: Lyon County, Kansas - Wikipedia

Miami County is included in the Kansas City, MO-KS Metropolitan Statistical Area.
As of the 2000 census, there were 28,351 people, 10,365 households, and 7,794 families residing in the county. The population density was 49 people per square mile (19/km2). There were 10,984 housing units at an average density of 19 per square mile (7/km2). The racial makeup of the county was 95.96% White, 1.54% Black or African American, 0.52% Native American, 0.17% Asian, 0.01% Pacific Islander, 0.44% from other races, and 1.36% from two or more races. Hispanic or Latino of any race were 1.59% of the population.
There were 10,365 households, out of which 37.00% had children under the age of 18 living with them, 63.50% were married couples living together, 8.00% had a female householder with no husband present, and 24.80% were non-families. 21.00% of all households were made up of individuals, and 8.80% had someone living alone who was 65 years of age or older. The average household size was 2.66 and the average family size was 3.09.
In the county, the population was spread out, with 27.90% under the age of 18, 7.30% from 18 to 24, 29.70% from 25 to 44, 23.10% from 45 to 64, and 11.90% who were 65 years of age or older. The median age was 37 years. For every 100 females there were 97.80 males. For every 100 females age 18 and over, there were 96.00 males.
The median income for a household in the county was $46,665, and the median income for a family was $55,830. Males had a median income of $37,441 versus $27,271 for females. The per capita income for the county was $21,408. About 3.60% of families and 5.50% of the population were below the poverty line, including 5.40% of those under age 18 and 8.40% of those age 65 or over.
For more information visit: Miami County, Kansas - Wikipedia
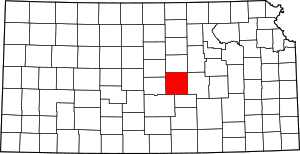
The McPherson Micropolitan Statistical Area includes all of McPherson County.
As of the census of 2000, there were 29,554 people, 11,205 households, and 7,966 families residing in the county. The population density was 33 people per square mile (13/km2). There were 11,830 housing units at an average density of 13 per square mile (5/km2). The racial makeup of the county was 96.53% White, 0.81% Black or African American, 0.34% Native American, 0.32% Asian, 0.06% Pacific Islander, 0.79% from other races, and 1.16% from two or more races. 1.94% of the population were Hispanic or Latino of any race. 37.1% were of German, 12.9% Swedish, 12.1% American, 6.7% English and 6.3% Irish ancestry according to Census 2000.
There were 11,205 households, out of which 33.00% had children under the age of 18 living with them, 62.50% were married couples living together, 6.00% had a female householder with no husband present, and 28.90% were non-families. 25.50% of all households were made up of individuals, and 11.80% had someone living alone who was 65 years of age or older. The average household size was 2.49 and the average family size was 2.99.
In the county, the population was spread out, with 25.40% under the age of 18, 10.30% from 18 to 24, 25.20% from 25 to 44, 21.80% from 45 to 64, and 17.30% who were 65 years of age or older. The median age was 38 years. For every 100 females there were 95.90 males. For every 100 females age 18 and over, there were 92.90 males.
The median income for a household in the county was $41,138, and the median income for a family was $48,243. Males had a median income of $33,530 versus $21,175 for females. The per capita income for the county was $18,921. About 4.20% of families and 6.60% of the population were below the poverty line, including 5.20% of those under age 18 and 8.10% of those age 65 or over.
For more information visit: McPherson County, Kansas - Wikipedia

The Hays Micropolitan Statistical Area includes all of Ellis County.
As of the 2000, there were 27,507 people, 11,193 households, and 6,771 families residing in the county. The population density was 31 people per square mile (12/km2). There were 12,078 housing units at an average density of 13 per square mile (5/km2). The racial makeup of the county was 96.10% White, 0.67% Black or African American, 0.21% Native American, 0.82% Asian, 0.02% Pacific Islander, 1.31% from other races, and 0.89% from two or more races. Hispanic or Latino of any race were 2.37% of the population.
There were 11,193 households, out of which 28.80% had children under the age of 18 living with them, 50.00% were married couples living together, 7.80% had a female householder with no husband present, and 39.50% were non-families. 30.10% of all households were made up of individuals, and 10.80% had someone living alone who was 65 years of age or older. The average household size was 2.35 and the average family size was 2.96.
In the county, the population was spread out, with 22.40% under the age of 18, 18.40% from 18 to 24, 25.20% from 25 to 44, 19.60% from 45 to 64, and 14.30% who were 65 years of age or older. The median age was 33 years. For every 100 females there were 95.80 males. For every 100 females age 18 and over, there were 92.60 males.
The median income for a household in the county was $32,339, and the median income for a family was $44,498. Males had a median income of $29,885 versus $21,269 for females. The per capita income for the county was $18,259. About 6.50% of families and 12.90% of the population were below the poverty line, including 9.20% of those under age 18 and 10.00% of those age 65 or over.
For more information visit: Ellis County, Kansas - Wikipedia

The Great Bend Micropolitan Statistical Area includes all of Barton County.
As of the 2000 census, there were 28,205 people, 11,393 households, and 7,530 families residing in the county. The population density was 32 people per square mile (12/km2). There were 12,888 housing units at an average density of 14 per square mile (6/km2). The racial makeup of the county was 92.98% White, 1.15% Black or African American, 0.51% Native American, 0.23% Asian, 0.01% Pacific Islander, 3.51% from other races, and 1.60% from two or more races. Hispanic or Latino of any race were 8.31% of the population.
There were 11,393 households, out of which 31.30% had children under the age of 18 living with them, 55.10% were married couples living together, 7.80% had a female householder with no husband present, and 33.90% were non-families. 30.20% of all households were made up of individuals, and 14.30% had someone living alone who was 65 years of age or older. The average household size was 2.41 and the average family size was 3.01.
In the county, the population was spread out, with 26.00% under the age of 18, 9.00% from 18 to 24, 25.10% from 25 to 44, 22.00% from 45 to 64, and 17.90% who were 65 years of age or older. The median age was 39 years. For every 100 females there were 93.80 males. For every 100 females age 18 and over, there were 90.10 males.
The median income for a household in the county was $32,176, and the median income for a family was $39,929. Males had a median income of $28,803 versus $20,428 for females. The per capita income for the county was $16,695. About 9.90% of families and 12.90% of the population were below the poverty line, including 17.00% of those under age 18 and 10.90% of those age 65 or over.
For more information visit: Barton County, Kansas - Wikipedia

Franklin County comprises the Ottawa, KS Micropolitan Statistical Area, which is included in the Kansas City-Overland Park-Kansas City, MO-KS Combined Statistical Area.
As of the U.S. Census in 2000, there were 24,784 people, 9,452 households, and 6,720 families residing in the county. The population density was 43 people per square mile (17/km2). There were 10,229 housing units at an average density of 18 per square mile (7/km2). The racial makeup of the county was 95.05% White, 1.21% Black or African American, 0.94% Native American, 0.31% Asian, 0.78% from other races, and 1.71% from two or more races. Hispanic or Latino of any race were 2.62% of the population.
There were 9,452 households, out of which 34.70% had children under the age of 18 living with them, 58.10% were married couples living together, 8.90% had a female householder with no husband present, and 28.90% were non-families. 24.80% of all households were made up of individuals, and 11.30% had someone living alone who was 65 years of age or older. The average household size was 2.56 and the average family size was 3.04.
In the county, the population was spread out, with 27.50% under the age of 18, 8.90% from 18 to 24, 28.30% from 25 to 44, 21.20% from 45 to 64, and 14.00% who were 65 years of age or older. The median age was 36 years. For every 100 females there were 98.30 males. For every 100 females age 18 and over, there were 94.10 males.
The median income for a household in the county was $39,052, and the median income for a family was $45,197. Males had a median income of $31,223 versus $22,992 for females. The per capita income for the county was $17,311. About 5.60% of families and 7.70% of the population were below the poverty line, including 8.40% of those under age 18 and 7.30% of those age 65 or over.
For more information visit: Franklin County, Kansas - Wikipedia

The Liberal, KS Micropolitan Statistical Area includes all of Seward County.
As of the census of 2000, there were 22,510 people, 7,419 households, and 5,504 families residing in the county. The population density was 35 people per square mile (14/km2). There were 8,027 housing units at an average density of 13 per square mile (5/km2). The racial makeup of the county was 65.44% White, 3.78% Black or African American, 0.77% Native American, 2.86% Asian, 0.06% Pacific Islander, 23.81% from other races, and 3.27% from two or more races. 42.14% of the population were Hispanic or Latino of any race.
There were 7,419 households, out of which 43.50% had children under the age of 18 living with them, 59.60% were married couples living together, 10.00% had a female householder with no husband present, and 25.80% were non-families. 20.60% of all households were made up of individuals, and 7.80% had someone living alone who was 65 years of age or older. The average household size was 2.98 and the average family size was 3.46.
In the county, the population was spread out, with 32.00% under the age of 18, 11.70% from 18 to 24, 30.50% from 25 to 44, 16.90% from 45 to 64, and 8.90% who were 65 years of age or older. The median age was 29 years. For every 100 females, there were 105.30 males. For every 100 females age 18 and over, there were 103.70 males.
The median income for a household in the county was $36,752, and the median income for a family was $41,134. Males had a median income of $29,765 versus $21,889 for females. The per capita income for the county was $15,059. About 13.90% of families and 16.90% of the population were below the poverty line, including 21.00% of those under age 18 and 7.30% of those age 65 or over.
For more information visit: Seward County, Kansas - Wikipedia

Pottawatomie County is part of the Manhattan Metropolitan Statistical Area.
As of the census of 2000, there were 18,209 people, 6,771 households, and 4,929 families residing in the county. The population density was 22 people per square mile (8/km2). There were 7,311 housing units at an average density of 9 per square mile (3/km2). The racial makeup of the county was 96.32% White, 0.66% Black or African American, 0.59% Native American, 0.32% Asian, 0.01% Pacific Islander, 0.60% from other races, and 1.50% from two or more races. 2.26% of the population were Hispanic or Latino of any race.
There were 6,771 households, out of which 36.40% had children under the age of 18 living with them, 62.40% were married couples living together, 7.20% had a female householder with no husband present, and 27.20% were non-families. 23.20% of all households were made up of individuals, and 9.70% had someone living alone who was 65 years of age or older. The average household size was 2.65 and the average family size was 3.15.
In the county, the population was spread out, with 29.50% under the age of 18, 7.70% from 18 to 24, 27.70% from 25 to 44, 21.60% from 45 to 64, and 13.50% who were 65 years of age or older. The median age was 36 years. For every 100 females, there were 98.00 males. For every 100 females age 18 and over, there were 96.70 males.
The median income for a household in the county was $40,176, and the median income for a family was $47,261. Males had a median income of $31,368 versus $23,238 for females. The per capita income for the county was $17,785. About 6.40% of families and 9.70% of the population were below the poverty line, including 14.10% of those under age 18 and 10.30% of those age 65 or over.
For more information visit: Pottawatomie County, Kansas - Wikipedia
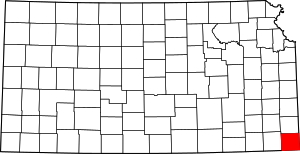
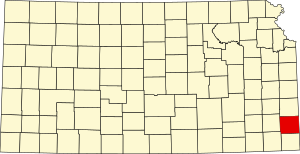
As of the 2000 census, there were 22,605 people, 8,875 households, and 6,239 families residing in the county. The population density was 38 people per square mile (15/km2). There were 10,031 housing units at an average density of 17 per square mile (7/km2). The racial makeup of the county was 92.27% White, 0.61% Black or African American, 3.45% Native American, 0.23% Asian, 0.04% Pacific Islander, 0.50% from other races, and 2.90% from two or more races. Hispanic or Latino of any race were 1.29% of the population.
There were 8,875 households, out of which 32.40% had children under the age of 18 living with them, 56.60% were married couples living together, 9.70% had a female householder with no husband present, and 29.70% were non-families. 26.30% of all households were made up of individuals, and 13.00% had someone living alone who was 65 years of age or older. The average household size was 2.51 and the average family size was 3.02.
In the county, the population was spread out, with 26.50% under the age of 18, 8.40% from 18 to 24, 26.90% from 25 to 44, 23.10% from 45 to 64, and 15.20% who were 65 years of age or older. The median age was 37 years. For every 100 females there were 94.20 males. For every 100 females age 18 and over, there were 90.70 males.
The median income for a household in the county was $30,505, and the median income for a family was $37,284. Males had a median income of $29,045 versus $19,675 for females. The per capita income for the county was $14,710. About 11.40% of families and 14.30% of the population were below the poverty line, including 19.40% of those under age 18 and 10.60% of those age 65 or over.
For more information visit: Cherokee County, Kansas - Wikipedia

As of the 2000 census, there were 19,344 people, 7,903 households, and 5,421 families residing in the county. The population density was 23 people per square mile (9/km2). There were 8,686 housing units at an average density of 10 per square mile (4/km2). The county's racial makeup was 96.44% White, 0.58% Black or African American, 0.49% Native American, 0.30% Asian, 0.01% Pacific Islander, 0.82% from other races, and 1.36% from two or more races. Hispanic or Latino of any race were 2.30% of the population.
There were 7,903 households, of which 31.10% had children under the age of 18 living with them, 57.90% were married couples living together, 7.70% had a female householder with no husband present, and 31.40% were non-families. 28.10% of households were made up of individuals, and 14.10% had someone living alone who was 65 years of age or older. The average household size was 2.40 and the average family size was 2.94.
In the county, the population was spread out, with 25.70% under the age of 18, 6.30% from 18 to 24, 26.30% from 25 to 44, 23.10% from 45 to 64, and 18.60% who were 65 years of age or older. The median age was 40 years. For every 100 females there were 95.10 males. For every 100 females age 18 and over, there were 91.60 males.
The county's median household income was $35,975, and the median family income was $43,952. Males had a median income of $30,889 versus $18,526 for females. The per capita income in the county was $17,780. About 5.30% of families and 7.50% of the population were below the poverty line, including 8.70% of those under age 18 and 11.30% of those age 65 or over.
For more information visit: Dickinson County, Kansas - Wikipedia